nClouds is a Managed DevOps Solutions Provider. We help to implement effective processes and tools to reduce unplanned work and provide visibility. We manage many Celery deployments. A quick Google search on Celery and you’ll find that people have issues with Celery’s performance, especially if you are using Redis as a broker— apparently, this is a bad idea.
A common suggestion is to move away from Celery or switch the broker to RabbitMQ. However, before switching to RabbitMQ, we wanted to make sure we get to the bottom of the issue. Like Edwards Deming said, without data, you’re just another person with an opinion.
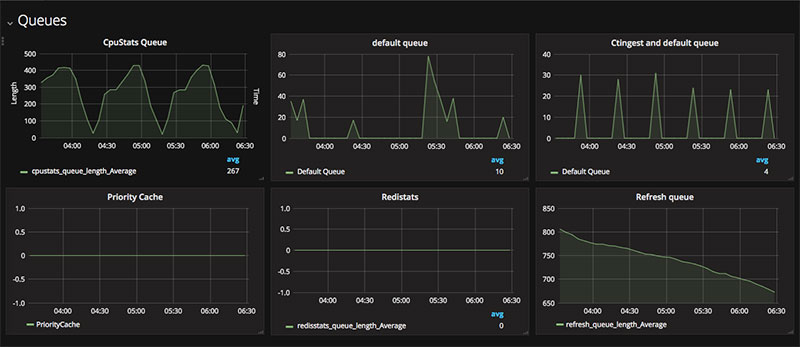
One of the common patterns that we saw was with tasks piling up and killing the workers, so we decided to graph the queue length (code is shared below) for all our Celery workers to figure out which queues were always behind. And then using celeryctl and analyzing the queue in question, we shuffled things around, optimized the code which resulted in fewer Celery issues.
So just by graphing the queue length, our attitude went from ‘Celery sucks’ to ‘we have to optimize the tasks for these workers’.
Current setup:
We migrated Celery to ECS and gave each worker its own service. We used ecs-refarch-cloudformation as a blueprint (check out our blog post about continuous deployment using Jenkins) and run Celery in ECS to ensure ECS launches a new container if celery runs out of memory.
We are currently using Redis as a broker.
Everyone suggests Redis is bad for managing queues because it depends on polling and doesn’t scale. RabbitMQ provides a smooth mechanism for scaling with “publisher and subscribe” handling messages.
We already had Redis in place, and it was the fastest and cleanest solution. To provide a bug-free flow, we added simple locks based on native Redis TTL keys via standard python bindings (no hacky libs or weird dependencies). Tasks were thoroughly profiled and debugged, which made our graphs look like heartbeats with stable ranges.
There was another corner case: Redis persists all the data in-memory. We had to work around this by storing checkpoints for tasks in MySQL table, so they wouldn’t start from the beginning if any of them failed.
We were, clearly, one of those people that thought Celery-Redis wasn’t a good combination. However, once we put visualization in place, we were able to fix the issues.
Here is the code fragment for graphing Redis queue in cloudwatch:
QUEUE_NAMES = []

def send_redis_stats_cw():
    backup_count = 0
    uri = urlparse.urlparse()
    # Create a namespace for our queue data
    namespace = uri.hostname + '_redis'
    client = redis.Redis(host=uri.hostname, port=uri.port, db=)

    result = dict()
    for q in QUEUE_NAMES:
        length = client.llen(q)
        if length > backup_count:
            status = "critical"
        else:
            status = "ok"
     # result is a dict object indexed by queue name which holds the queue length, and a status value
     result[q] = {"total": length, "status": status}

   # We will log this data to CloudWatch
    start = time.time()

    for q in QUEUE_NAMES:
        cw_conn.put_metric_data(Namespace=namespace,
                                MetricData=[
                                    {
                                        'MetricName': q + '_queue_length',
                                        'Timestamp': datetime.datetime.now(),
                                        'Value': float(result[q]['total']),
                                        'Unit': 'Count'
                                    },
                                ])
    end = time.time()
    //You  can use end - start to profile the time the puts to CloudWatch took
You can run the above code periodically using a separate Celery Queue/Worker.
Here is a sample definition that runs the above function every 15 mins.
REDIS_Q_POLLER = {
    'redis_q_poller': {
        'task': 'send_redis_stats_cw',
        'schedule': timedelta(minutes=15),
    }
}
Once you have your data in CloudWatch, you can leverage Grafana.
With Grafana, you can connect to cloudwatch graphs. It’s much more convenient to view the graphs in Grafana because most of the time logging in to AWS requires MFA. Creating a dashboard for each environment is very useful.
As you can see, adopting Devops increases operational excellence, and you can focus on delivering awesome products and increase customer satisfaction.