Zabbix is an open-source monitoring software tool for IT components that can help you improve operational excellence on AWS – a pillar of the AWS Well-Architected Framework. Zabbix helps you control your infrastructure by collecting any metric type from any metric source. Zabbix automatically provides its users with flexible, intelligent threshold definition options. With Zabbix, it is possible to use all the power of your supported functions and operators for the statistical analysis of your historical data; and then use multiple messaging channels to notify the responsible personnel about changes or abnormalities in events occurring in your environment.
Zabbix is used on networks, servers, virtual machines (VMs), and cloud services. Zabbix comes with out-of-the-box templates that are service-ready for many operating systems. These Zabbix templates contain predefined system alerts, which Zabbix calls triggers, making it very easy to add new monitoring devices. And, “open source” means that it is free to use.
The following tutorial will show you how to configure and deploy the Zabbix Front-end Server, and demonstrate its usefulness as a monitoring platform for application instances/hosts. You will learn how the breadth and scope of Zabbix monitoring will add to the excellence of your operating system.
First, we need to create a database in the Zabbix server where it stores the details of any servers to be monitored. Then, we need to configure the Zabbix agent on the hosts, which sends the metric’s data to the Zabbix server. Zabbix will then be deployed on our own web server.
Next, we will launch two Ubuntu 18.04 Amazon Machine Image (AMI) instances from the Amazon Elastic Compute Cloud (Amazon EC2) Console … instance type t2.micro will be sufficient. The first AMI is for the Zabbix front-end server. The second AMI is to test its monitoring of hosts/instances. Afterward, we name them, respectively, as main-server and client-server. It is important to remember to select “Inbound Custom TCP” for Port 10050 for Zabbix.
SSH in both of the instances and run the following commands:
wgetsudo dpkg -i zabbix-release_5.4-1+ubuntu18.04_all.deb sudo apt update -y Document reference link: https://www.zabbix.com/download?zabbix=5.4&os_distribution=ubuntu&os_version=18.04_bionic&db=mysql&ws=apache
Use the following commands to install Zabbix Front-end Server on the main-server instance.
We will install Zabbix server, front-end, agent, and database as prerequisites for it:
sudo apt install -y zabbix-server-mysql zabbix-frontend-php zabbix-apache-conf zabbix-agent mysql-server zabbix-sql-scripts sudo mysql -V && sudo apache2 -v && sudo php --versionLet’s secure our MySQL server and give a password to the root user of DB:
sudo mysql_secure_installationUse the answers below in order:
VALIDATE PASSWORD PLUGIN – no
Please set the password for root here – password #password is password
Remove anonymous users – yes
Disallow root login remotely – no
Remove test database and access to it – yes
Reload privileges table: Yes
Create an initial database and a user:
sudo mysql -u root -pLog in to MySQL server & enter root password (it’s password).
create database zabbix character set utf8 collate utf8_bin;Create a database with the name as zabbix.
create user zabbix@localhost identified by 'password'; Create a new user with the name zabbix & password as password also.
grant all privileges on zabbix.* to zabbix@localhost; Grant permissions on the zabbix database to user zabbix.
flush privileges; quit; Import initial schema and data – this can take up to 1 minute:
sudo zcat /usr/share/doc/zabbix-sql-scripts/mysql/create.sql.gz | mysql -uzabbix -p zabbixUpdate Zabbix Server Config file:
sudo nano /etc/zabbix/zabbix_server.confUncomment and mention password as:
DBPassword=passwordConfigure PHP for Zabbix front-end:
sudo nano /etc/zabbix/apache.confLook for # php_value date.timezone Europe/Riga below PHP 7.0 configuration & update your timezone accordingly. You can check from here: https://www.php.net/manual/en/timezones.asia.php
php_value date.timezone Asia/Kolkata.Start Zabbix server and agent processes and make it start at system boot:
sudo systemctl restart zabbix-server zabbix-agent apache2sudo systemctl enable zabbix-server zabbix-agent apache2Next, Open your browser with this link https://<ec2-ip_address>/zabbix to complete the installation process.
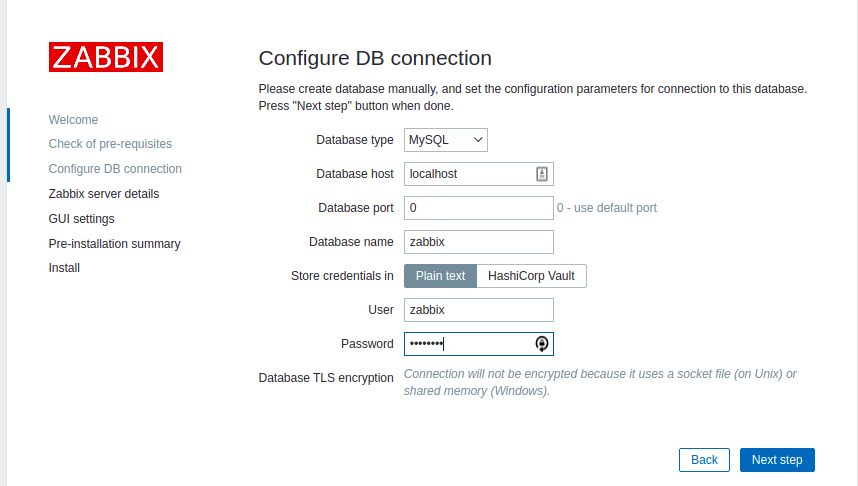
Below is an image of the front end of this platform, where we need to provide details for the username and password, which we have mentioned in its configuration file.
Log in to the Zabbix Server.
The default credentials are as follows:
Username: Admin
Password: zabbix
The Zabbix front-end server is now deployed successfully.
Now we have to perform steps on the second instance – the client-server instance.
Do not forget this step if not done already.
We could do the next step with the AWS Systems Manager and Ansible if we had multiple servers/hosts. For now, we will do this manually by SSH into the monitor-server instance. Then proceed to the following step and run these commands:
Install zabbix-agent:
sudo apt install zabbix-agentGenerate a pre-shared key (PSK) to secure the connection between the server and the agent:
sudo sh -c "openssl rand -hex 32 > /etc/zabbix/zabbix_agentd.psk"cat /etc/zabbix/zabbix_agentd.pskWe will be using this output later on while configuring hosts on the Zabbix web UI.
Make the changes in the Zabbix Agent configuration file, just replace sentences as mentioned below :
sudo nano /etc/zabbix/zabbix_agentd.conf### Option: Server
Replace Server=127.0.0.1 with Server=<ip_address_of_main-server>
### Option: TLSConnect
Replace # TLSConnect=unencrypted with TLSConnect=psk
### Option: TLSAccept
Replace # TLSAccept=unencrypted with TLSAccept=psk
### Option: TLSPSKIdentity
Replace # TLSPSKIdentity= with TLSPSKIdentity=ZabbixPSK-01
### Option: TLSPSKFile
Replace # TLSPSKFile= with TLSPSKFile=/etc/zabbix/zabbix_agentd.pskRestart the Zabbix-Agent Service and enable it to start automatically during the system boot:
sudo systemctl restart zabbix-agentsudo systemctl enable zabbix-agent If UFW is installed and active on the instance, allow traffic on port 10050:
sudo ufw allow 10050/tcp Now that we have completed all the necessary steps for the instance levels, we will now specify the steps on the client-server being monitored on Zabbix by proceeding to the next steps on the Zabbix web UI: https://<ec2-ip_address>/zabbix
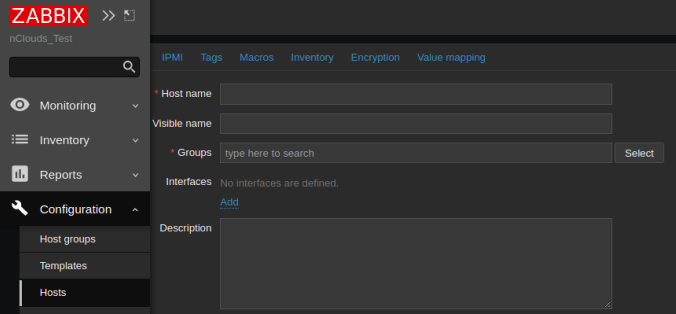
Click the Configuration option on the left side of the UI. Then click on Hosts. On the Host’s page, click Create Host (Right top side) to add the client (second server) instance.
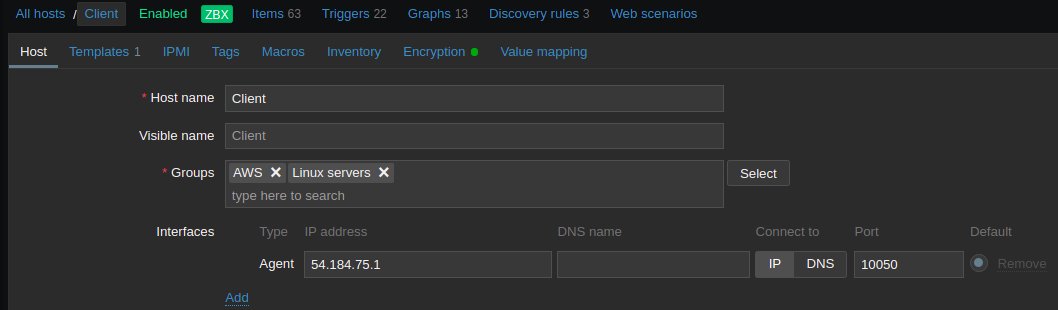
Enter the Host name of the client (client-server) instance and its IP address;
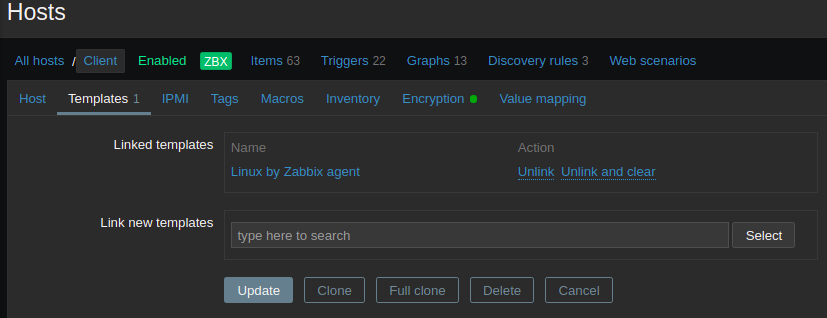
Now, in Templates select Linux by Zabbix agent. This will help to create the alerts (Triggers) by default (Like CPU, disk, status, memory, etc.).
Click the Encryption tab and set PSK, for “Connections to host” and “Connections from host.” Set PSK identity to the value of the TLS-PSK Identity configured in the Zabbix Agent configuration (i.e., ZabbixPSK-01). Then set the PSK value to the key generated during the configuration of the Agent, using this command: cat /etc/zabbix/zabbix_agentd.psk
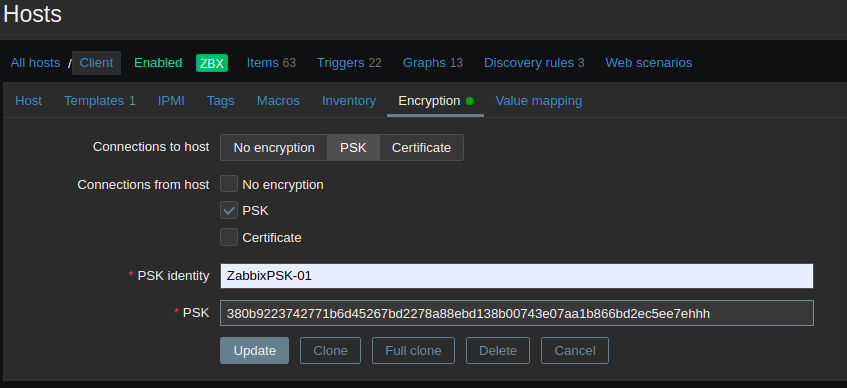
Then click on Add, or, if you are doing changes, you can click on Update, and then restart the zabbix-agent on the client server:
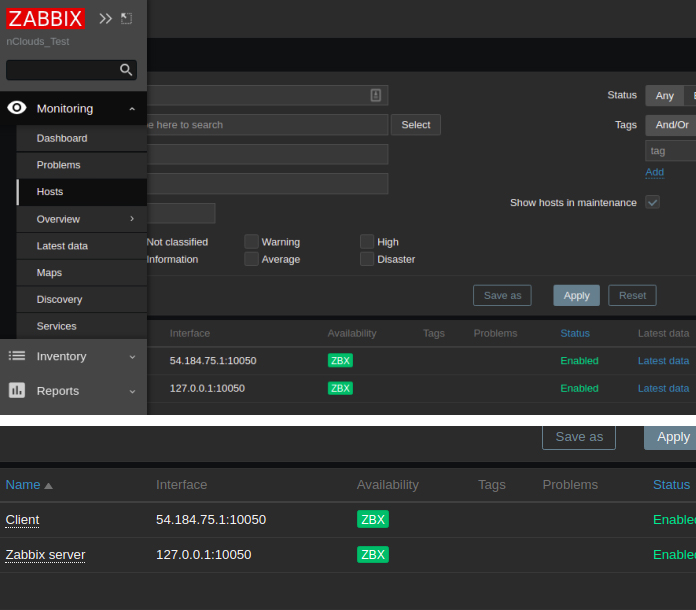
sudo systemctl restart zabbix-agentsudo systemctl status zabbix-agentRefresh the web UI also. Now you will see the client-server and Zabbix server under the Monitoring option on the left side. Then from there select Hosts.
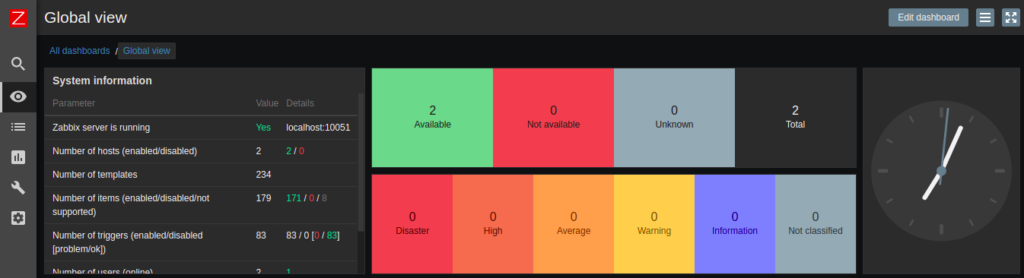
There are also some default dashboards for the servers to check on network performance and system performance.
This concludes the installation of the Zabbix server, and the tutorial on the necessary steps taken to configure which specific hosts are to be monitored.
By following the guidance above you can take steps toward improving operational excellence on AWS – and getting and staying Well-Architected.
Need help with infrastructure monitoring and operational excellence on AWS? The nClouds team is here to help with that and all your AWS infrastructure requirements.