Here at nClouds, we manage the infrastructure needs of many of our customers so that they can focus on building awesome products and delivering value to their customers.
Since we are managing the infrastructure of multiple customers, the number of alerts can skyrocket pretty quickly if not managed properly. So we always look for ways to reduce unintended noise to avoid alert fatigue. Alert fatigue is a term used to describe becoming desensitized when you’re bombarded by a large number of monitoring alerts and alarms, resulting in longer response times or ignoring important alarms. As organizational health consultant Patrick Lencioni explains in his book, Silos, Politics and Turf Wars: A Leadership Fable About Destroying the Barriers That Turn Colleagues Into Competitors, “If everything is important, then nothing is.”
While effective monitoring is a cornerstone of reliable cloud infrastructure, often monitoring alerts are created to capture information that does not require corrective action. Ideally, alerts should only be created if action needs to be taken immediately. We believe the monitoring system should tell us what’s broken and why. “What” is just a symptom, and why is the root cause. Understanding the difference between these two can help reduce noise.
For example, we manage one company’s AWS environment that runs loyalty and engagement platforms for retailers and restaurants. This customer is frequently running large online campaigns. A couple of weeks ago, during one of the campaigns, we noticed that Amazon Relational Database Service (Amazon RDS) IOPS started increasing.
Because of this issue, we started getting alerts from other areas being monitored. While generally, IOPS alerts are not a bad thing, if IOPS alerts are combined with alerts on increased Amazon RDS queue depth, this can be problematic. In this example, the queue depth alert is what that was broken, and the Amazon RDS IOPS was why the alert was triggered.
Let’s talk about some ways to reduce repetitive alerts, so when alerts get triggered, you can quickly find the root cause.
Alerts should be actionable
As mentioned above, one of the core tenets of effective monitoring is that all alerts need to be actionable. This kind of mindset is crucial because modern applications consist of a large set of components, from containers to serverless. It’s useful to collect metrics for these components for diagnostics, but when it comes to alerting, you need to ensure that alerts are actionable.
Let’s dive into the tactical steps you can take to make your alerts actionable.
Datadog composite monitor
We leverage Datadog’s composite monitor feature, which triggers — based on the presence or absence of multiple indicators — the combination of two existing alerts. For example, we create monitor A and monitor B. Then, we set a trigger condition using Boolean operators, such as A and B. The composite monitor triggers when the individual monitors simultaneously have values that cause the composite monitor’s trigger condition to be true.
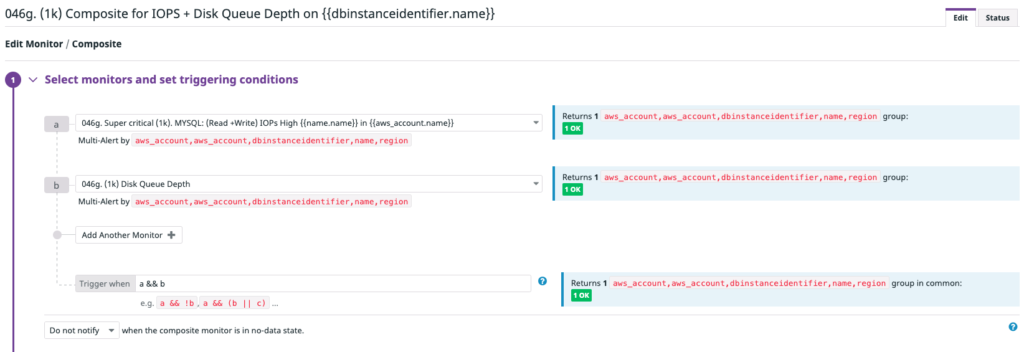
In the example I shared earlier, we’ll only trigger alerts when both the CPU load is high and Amazon RDS queue depth is high.
Prioritizing alerts
Some alerts are noisy but are low priority. While such warnings can be a handy reminder to examine or fix the root cause of the problem eventually, they are not adding value in the short term. So, we should not get paged for every alert.
Once a week, we have a meeting with the team to review the alerts and set priorities. It’s an important exercise to reduce the number of alerts.
Handling flapping alerts
Flapping alerts are those warnings that rapidly and frequently switch from an ‘ok’ to an ‘alert’ status when a service or host keeps changing its state. As a result, the channels and pagers become flooded with alerts and recovery notifications.
How do we solve this problem?
There are multiple ways to tackle this issue. We’ve found that the best methods include:
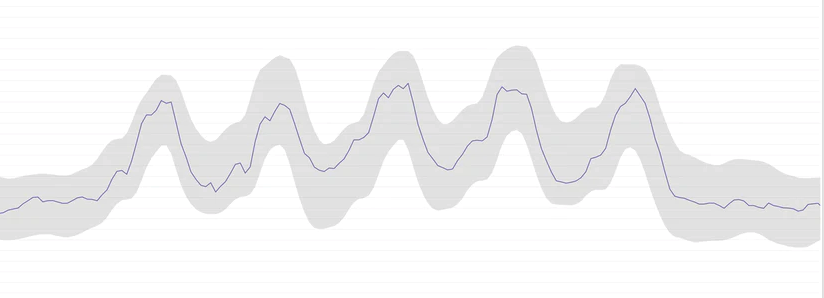
Anomaly detection — It’s challenging to set a static threshold for services that keep changing state. The values fluctuate very frequently. Anomaly detection algorithms can analyze historical behavior to detect abnormal behavior.
Using ‘at all times’ in the threshold — As we mentioned above, some metrics are so sensitive that they change very frequently within a very short time. Using min, max, sum, and average as criteria to create a violation and set a threshold in the alert condition is not feasible in this scenario. Using ‘at all times’ in the threshold triggers the alert only when all data points for the metric in the timeframe violate the threshold.
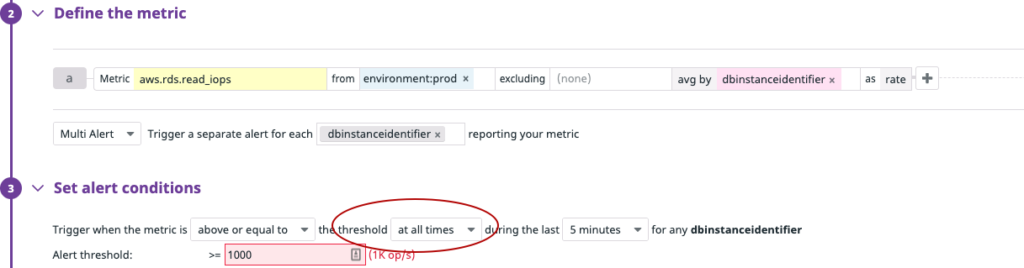
In the example above, we’ll only get an alert if all the checks exceed the threshold for a given window.
Well-established notification policies (page the right person at the right time)
When alerts get triggered, it’s essential to notify the right individuals or team at the right time. So we create separate notification channels to notify on-call users. We also configure alerts with tags to specify the environment and the corresponding key property so that an alert based on priority is sent to the right channel at the right time.
For example, only the production on-call team should get alerts from the production environment. Alerting the wrong team or individuals results in more escalations and poor mean time to repair (MTTR).
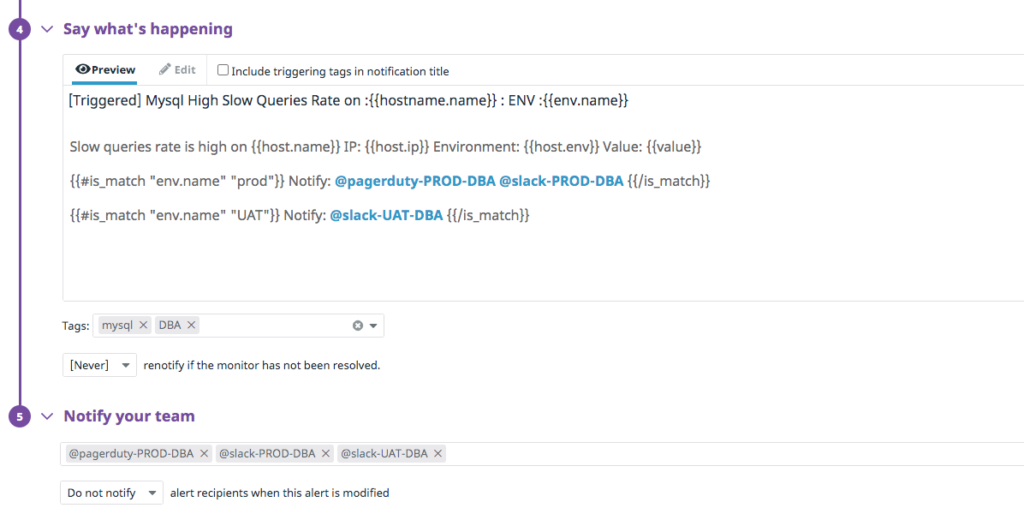
In the above screenshot, you can see the production database administrator (DBA) team’s PagerDuty and Slack channels will be notified when the alert triggers for the MySQL database in the production environment. And if an alert triggers for user acceptance testing (UAT), the UAT team will be notified by Slack. Using tags, we can easily notify the right team at the right time.
In conclusion
To avoid alert fatigue, we should only create alerts if action needs to be taken immediately. Ideally, the monitoring system should tell us what’s broken (the symptom) and why (the root cause). Tactical steps to make alerts actionable include using a Datadog composite monitor, prioritizing alerts, using anomaly detection or ‘at all times’ in the threshold to avoid flapping alerts, and setting policies to page the right person at the right time.
We hope you find this blog post useful. In the next blog post, we’ll cover proper contextual monitoring, conducting root cause analysis (RCA), reviewing alert reports, and predictive monitoring. We would love to hear from you about the steps you usually take to reduce the number of alerts.
Need help with meeting your AWS infrastructure support SLAs? Would you rather refocus your engineers on innovation instead of providing infrastructure support? The nClouds 24/7 Support Services team is here to help you maximize uptime and business continuity and achieve your AWS infrastructure support SLAs at a competitive rate.