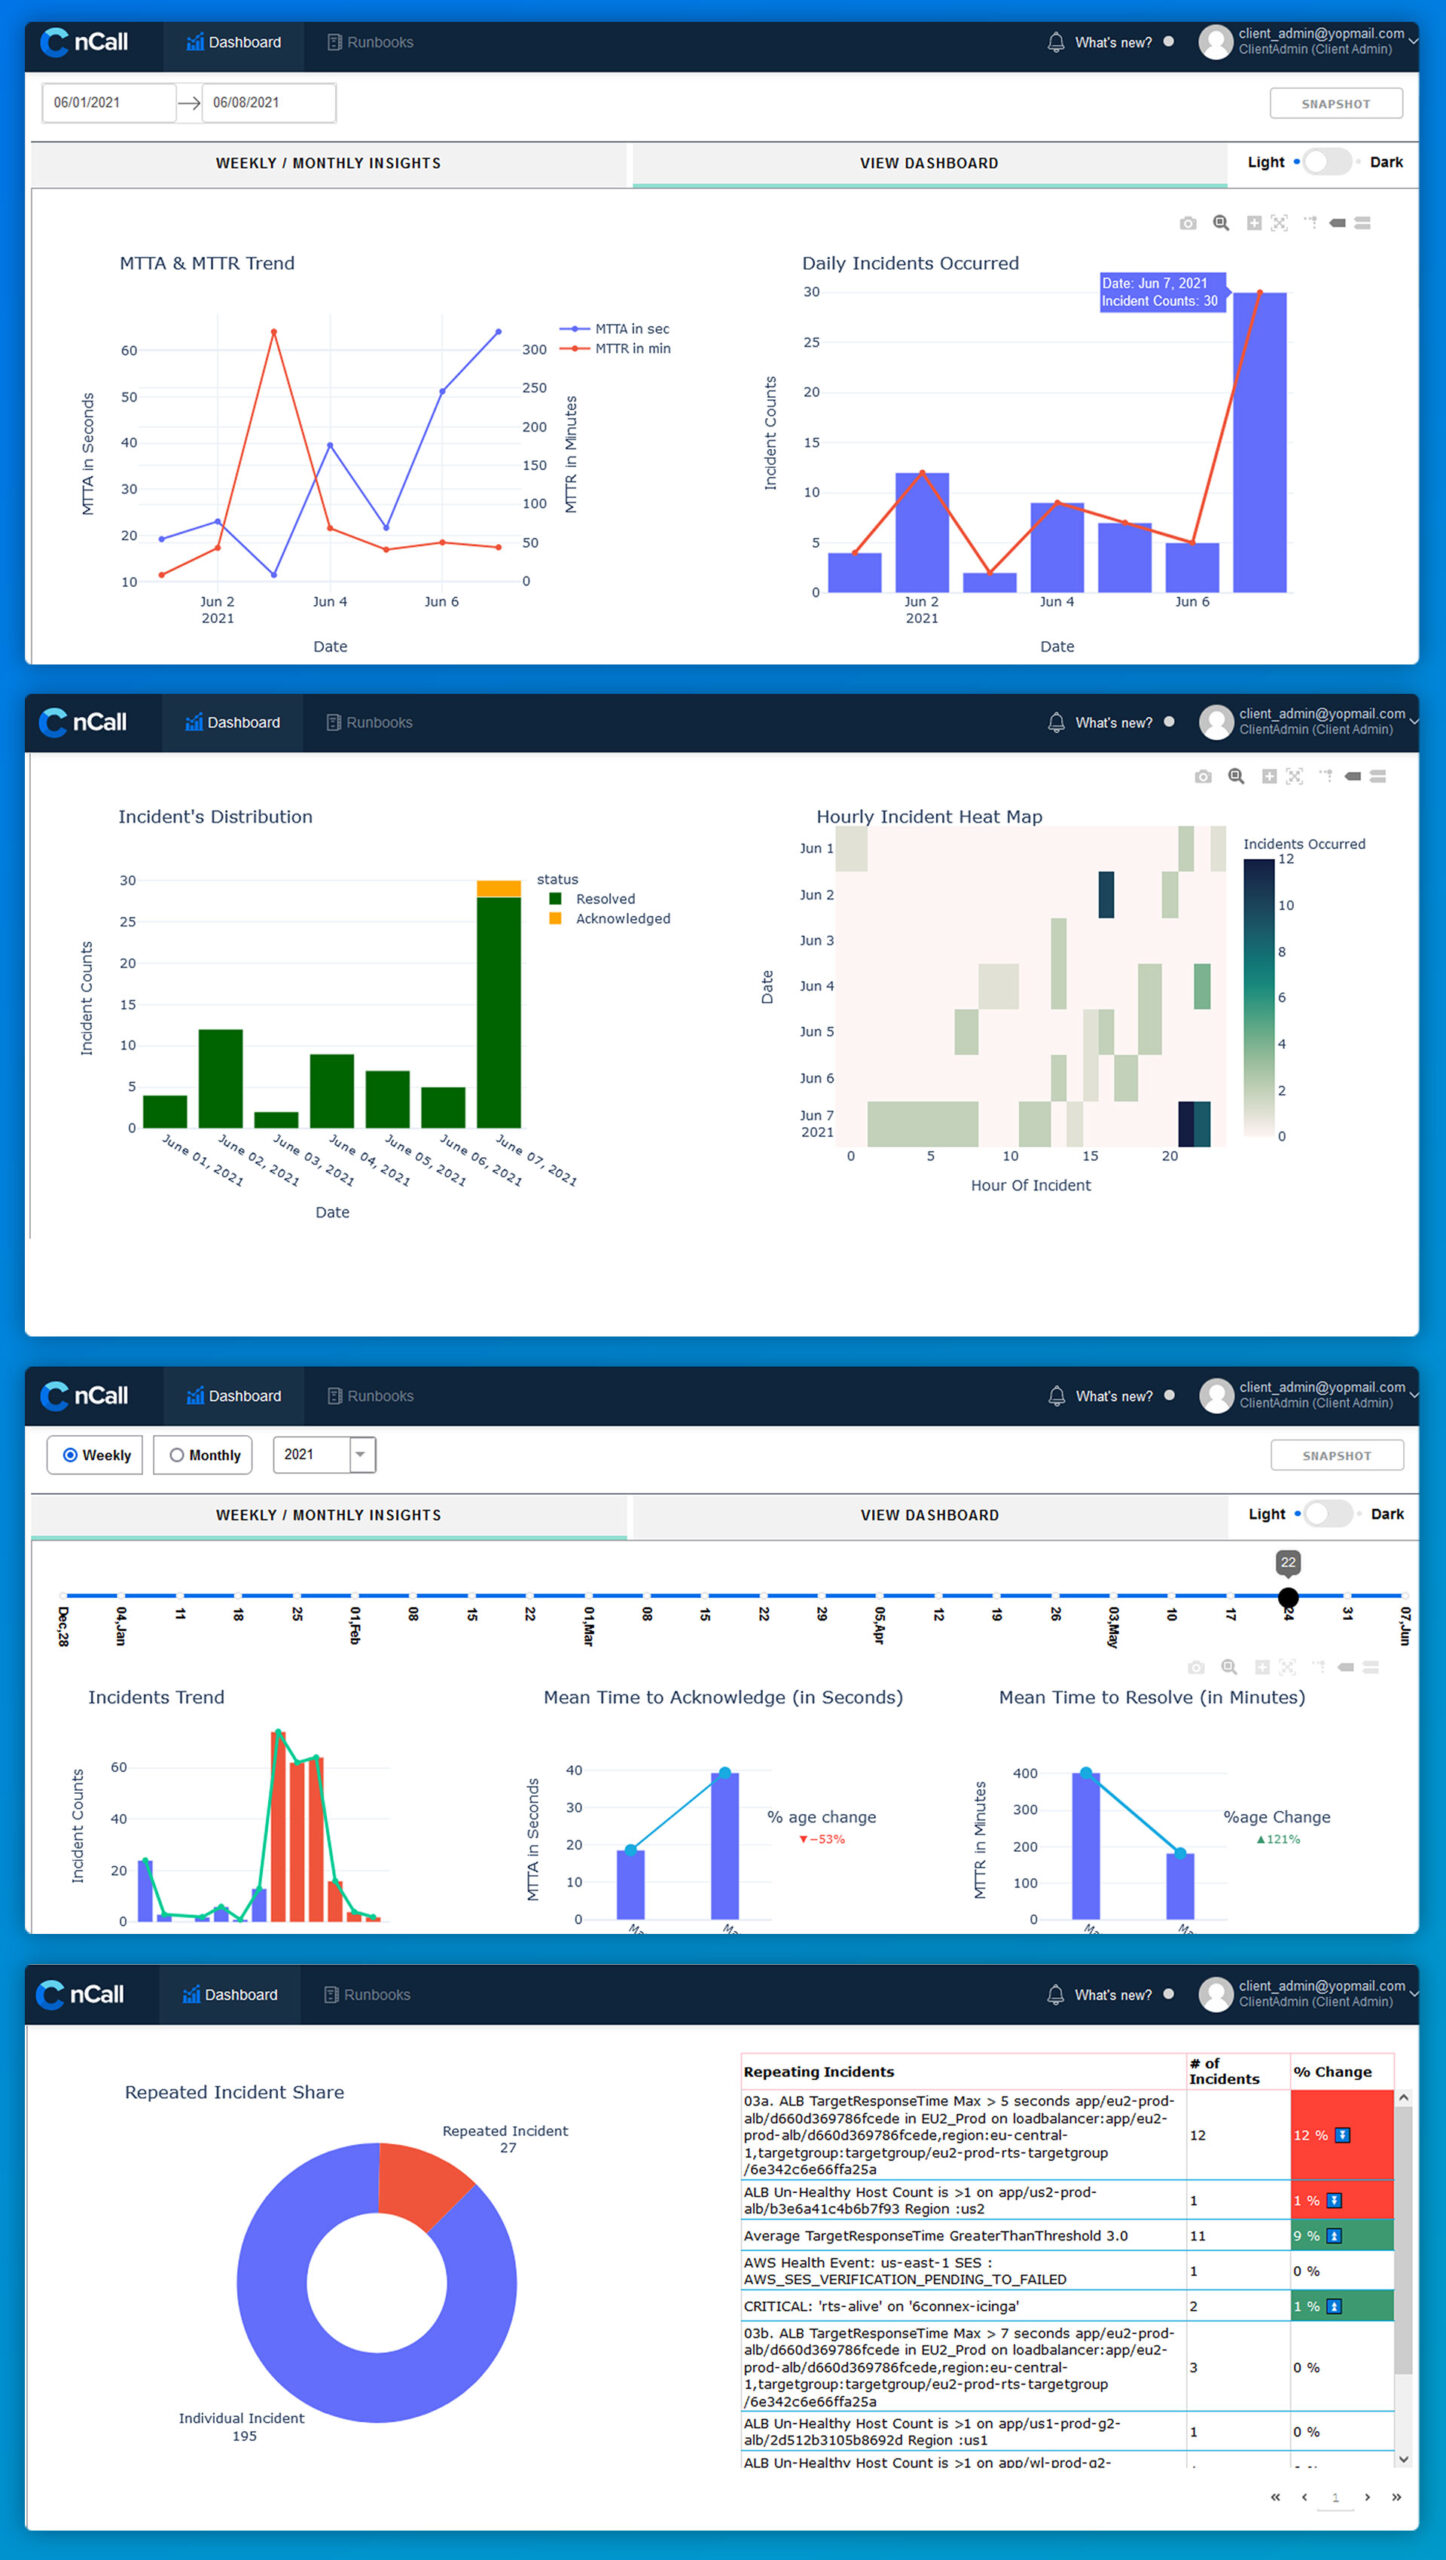
nClouds’ 24/7 Support Services engineers use Interactive Dashboards (using our tool, nCall) to accelerate incident management. They get rapid, real-time insights on MTTR trends, incident frequency, recurring incidents, and more — vital when difficulties arise and important remediation decisions must be made quickly.
These dashboards have embedded analytics that provide valuable insights into the health of our clients’ systems. Rich visualization of incident data enables support engineers to process information quickly to take appropriate action to improve system performance and avoid similar incidents in the future.
Our 24/7 Support Services engineers can customize dashboards based on requirements associated with each client’s systems.
- Visualization types. Tailor the types of visualizations for each dashboard, such as bar charts to compare metrics, line charts to track changes over time, heat maps to visualize correlation of two dimensions, etc. Alter fields, rewrite titles, select visualization themes, and change visual elements with drag-and-drop functionality. There’s also a built-in engine that will suggest visualizations based on the properties of the underlying datasets.
- Reporting. Snapshot functionality lets users download the visual dashboard in PDF form, and each graph can be downloaded as a PNG. Users can compare week over week and month over month data to gain insights and support data-driven decisions.
- Interactivity. These dashboards have rich interactivity, and our engineers can define which visuals should be interactive based on each client’s needs. Visuals can be linked within a dashboard — selecting a dimensional point on one visual provides granular insights on the selected point on other visuals within the dashboard. With advanced filtering via single point-and-click actions, our engineers can drill down into the details of incident metrics.
- Analysis. nCall’s Interactive Dashboard visualizations can be combined into an analysis to tell a story about the business implications of incident frequency, recurrence, and trends, and multiple iterations of an analysis can be connected to tell the story.
In conclusion
nCall’s Interactive Dashboards empower nClouds’ 24/7 Support Services engineers to fast-track incident management. With nCall’s rich visualization of incident data, our engineers can customize dashboards based on a client’s requirements to tell an integrated story about the business implications of incident frequency, recurrence, and trends.
Need help with meeting your AWS infrastructure support SLAs? Would you rather refocus your engineers on innovation instead of providing infrastructure support? The nClouds 24/7 Support Services team is here to help you maximize site uptime, performance, and stability and achieve your AWS infrastructure support SLAs at a competitive rate. Contact us.

View this on-demand webinar featuring SRE experts from nClouds & Datadog
How DevOps Teams Use SRE to Innovate Faster with Reliability.