
 All Posts





Blog Post
In 2012, SoundCloud engineers realized they had a problem. Their existing monitoring solutions were insufficient for their needs. Development teams need real-time, actionable monitoring data to improve Kubernetes deployment uptime, enhance system performance, and boost resource optimization. In other words, they needed a solution to handle the complexity and distributed nature of their cloud applications, while providing operational simplicity, scalability, and integration with a powerful query language.
They began developing Prometheus to meet these criteria. After developing Prometheus, they tackled another problem, visualization. They needed a system that helped them visualize what their monitoring data was telling them. And that is when they thought of combining the attributes of Prometheus and Grafana, another open-source program, which had been developed by Torkel Ödegaard. Prometheus and Grafana were both built for time-series data. However, whereas Prometheus excelled in metric data collection, Grafana championed metric visualizations. While Prometheus pulled the data from the metrics, Grafana could provide their visualization.
The Prometheus/Grafana combination was a successful proof of concept. The engineers could better understand whether an error or an anomaly had occurred. Even better, Prometheus and Grafana were open-source monitoring tools, which meant that their dashboards and alerts would run free of charge on Amazon Elastic Container Service for Kubernetes (Amazon EKS) and Kubernetes. At nClouds, we use the Prometheus/Grafana combination to set up monitoring and visualization tools for a variety of open-source clients.
Prerequisites: Before deploying and configuring Prometheus and Grafana, the following are required installations:
You can create your own cluster after installing the items listed above, and after configuring the AWS profile using the following command:
eksctl create cluster --name=grafana --nodes-min=1 --nodes-max=2 --node-type=t2.small --region=us-west-2 --version=1.21(grafana is the name of a cluster with a maximum of 2 nodes, of type t2.small, in the us-west-2 Region and the kubernetes version is 1.21)
Note: It may take up to 30 minutes to spin up all the necessary resources using an AWS CloudFormation (CloudFormation) template.
Ensure that the Amazon EKS cluster and node group have been created using the following command, which will show the details of nodes under the cluster.
kubectl get nodesOnce the cluster has been created, we can deploy our application using a YAML file. Create a namespace using this command:
kubectl create namespace testingDownload/copy this file’s content and save it as demo-grafana-test.yaml.
Run this command:
kubectl apply -f demo-grafana-test.yaml -n testingTo see all components of the deployment, run the following command:
kubectl get all -n testingNow, we need to install Kubernetes Metrics Server. It aggregates resource usage data in your cluster, and it is not deployed by default in Amazon EKS clusters.
Command:
kubectl apply -f https://github.com/kubernetes-sigs/metrics-server/releases/latest/download/components.yamlReference link: https://docs.aws.amazon.com/eks/latest/userguide/metrics-server.html
Now, we have all the prerequisites to deploy Grafana and Prometheus. Let’s create namespaces for Grafana and Prometheus to deploy their resources.
kubectl create namespace prometheuskubectl create namespace grafanaDeploying Prometheus
Add the prometheus-community chart repository:
helm repo add prometheus-communityReference link: https://prometheus-community.github.io/helm-charts
Deploy Prometheus:
helm upgrade -i prometheus prometheus-community/prometheus \
  --namespace prometheus \
  --set alertmanager.persistentVolume.storageClass="gp2",server.persistentVolume.storageClass="gp2"
Reference link: https://docs.aws.amazon.com/eks/latest/userguide/prometheus.html
Deploying Grafana
Create a file called grafana.yaml, then paste the contents into this file.
Deploy Grafana:
kubectl apply -f grafana.yaml -n grafanaReference link: https://grafana.com/docs/grafana/latest/installation/kubernetes/
Now we have both deployments ready. We can access both Prometheus and Grafana with the commands in the sections below, which will port forward our deployments. We will be using Prometheus as a data source for our Grafana browser as we have not created any web URL for Prometheus.
For Prometheus
Use the following command to forward your Prometheus deployment to port 9090:
kubectl port-forward -n prometheus deploy/prometheus-server 9090:9090Now open this URL in the web browser: https://localhost:9090/
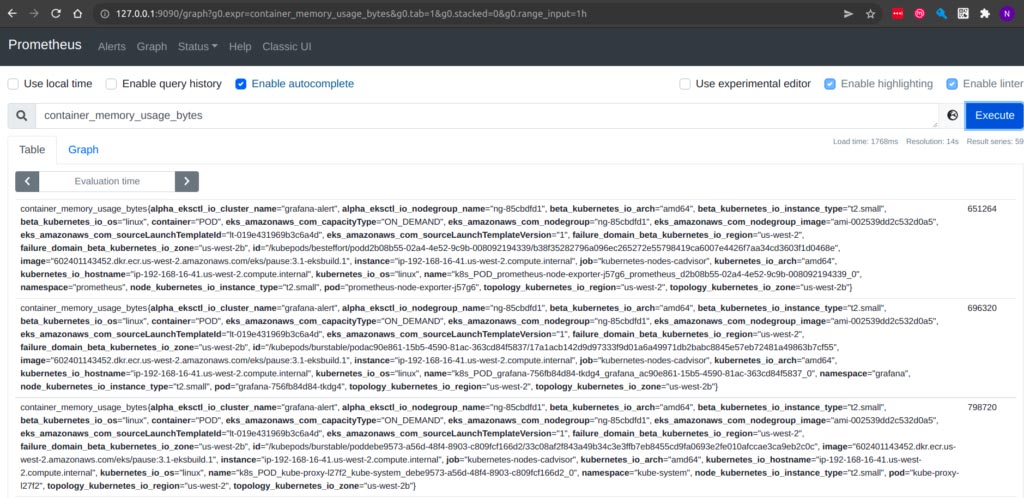
After port forwarding, you will get the Prometheus UI, shown below. Then you can search for any metrics in the search bar from the kube metrics-server:
For Grafana
Use the following command to forward Prometheus deployment to port 3000:
kubectl port-forward -n grafana deploy/grafana 3000:3000Now open this URL in the web browser: https://localhost:3000/
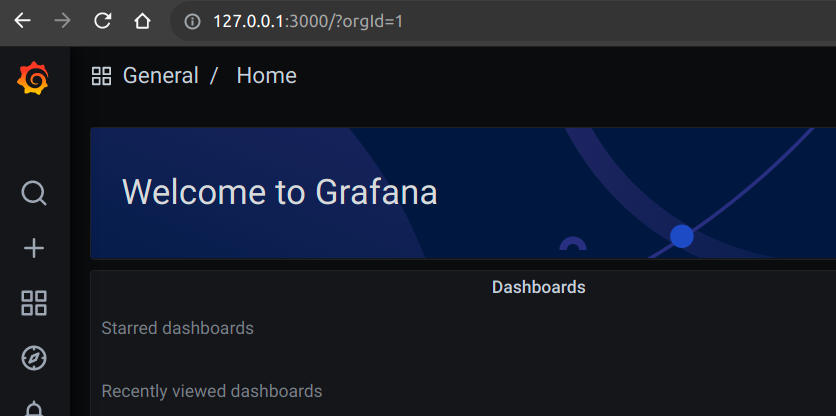
After port forwarding Grafana deployment, you can access Grafana UI, as shown below:
After completing the above steps, we need to add the data source by navigating to the bottom left in the configuration > Data Sources > select Prometheus and provide the details shown below:
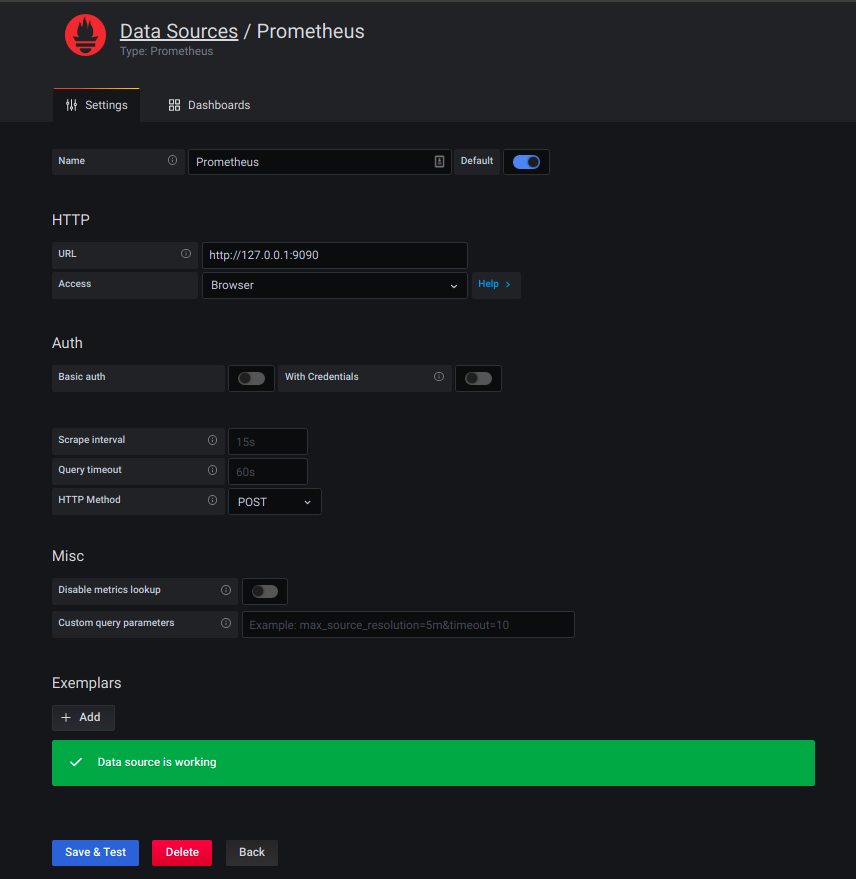
Note: Please do not use forward slash in the Prometheus URL https://127.0.0.1:9090 under the HTTP option.
Now, we need to add the dashboard by scrolling down under Dashboards > Manage, as shown below:
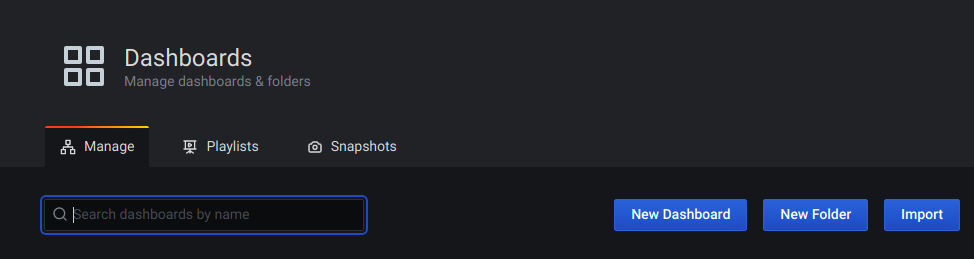
Then we need to select Import, which will get you to this page:
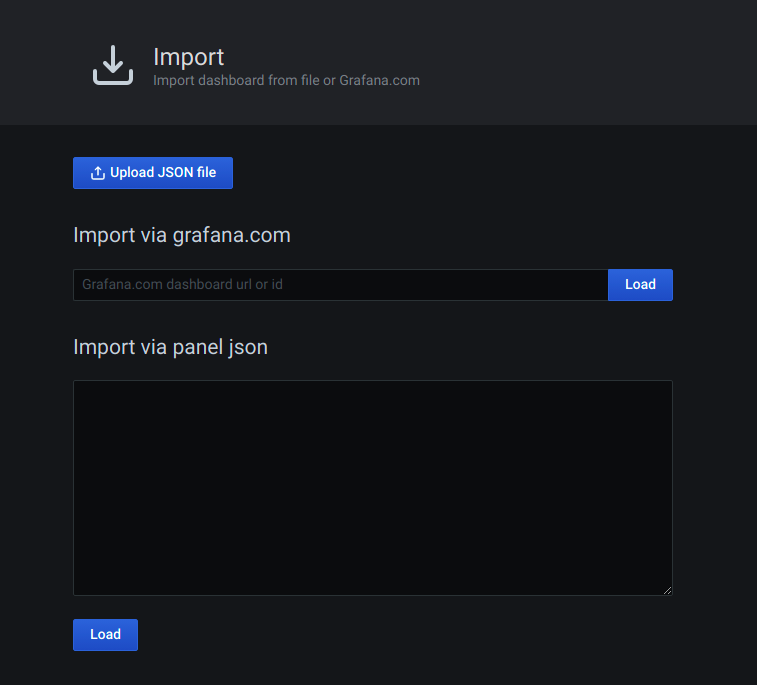
Grafana offers prebuilt dashboards. You can explore them using this link for pods-related dashboards: https://grafana.com/grafana/dashboards/?search=pods
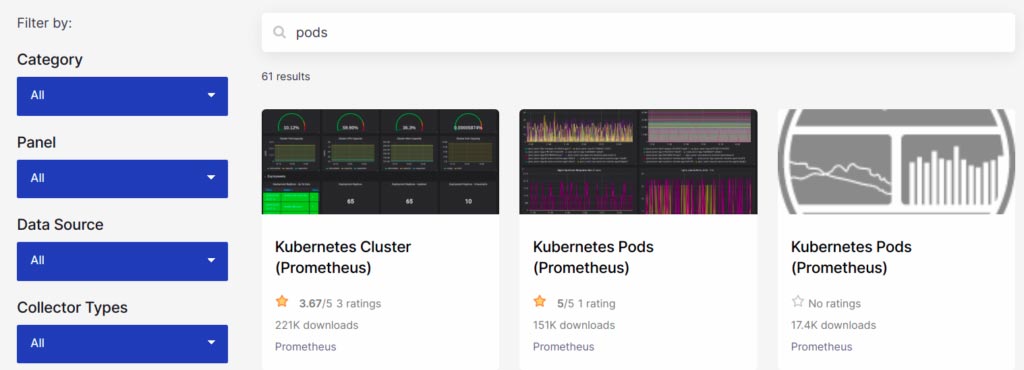
We can click on any of the dashboards shown under the result, and we will have a unique code/ID for each dashboard.
For example, we clicked on the dashboard Kubernetes pod and cluster monitoring (via Prometheus), which is accessible at this URL: https://grafana.com/grafana/dashboards/6663

In the import via grafana.com, we select Copy ID to Clipboard, paste the dashboard ID in it, and then click Load to access the dashboard shown below. You can save it and use the metrics in this dashboard to create alerts as well.
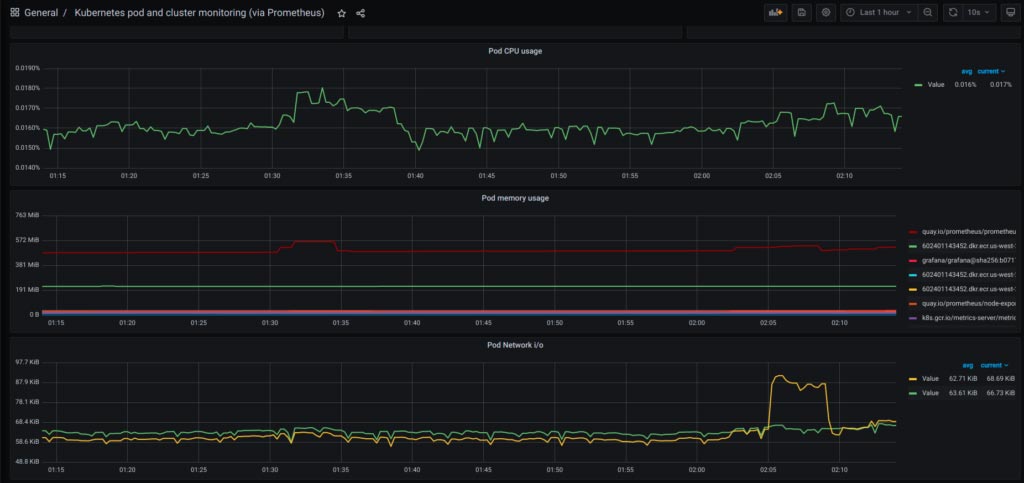
By following the steps above, we can deploy Prometheus and Grafana and the dashboards on our Amazon EKS infrastructure to monitor our application, improve Kubernetes deployment uptime, enhance system performance, and increase resource optimization.
Need help with Kubernetes on AWS? The nClouds team is here to help with that and all your AWS infrastructure requirements.
Blog Post

Blog Post

Blog Post

Blog Post
