






Blog Post
 All Posts
Blog Post
Recent studies indicate that the cost of IT downtime is between $9,000 – $12,000 per minute, depending on industry vertical, organization size, and business model. That cost includes business disruption, revenue loss, and end-user productivity.
To protect SLAs and mitigate downtime, the first approach is to accelerate the incident resolution process and find the root cause. In my previous blog post, I explained why it’s essential to conduct root cause analysis (RCA).
In this blog post, I’ll explain how to strengthen monitoring to take it up a level and accelerate the incident resolution process using service maps.
As you migrate an application from a monolithic architecture to a microservices-based architecture on the cloud, complexity increases. That complexity makes it challenging to form an accurate picture of the application.
Imagine that you get a call or page at night about an outage in your production environment. How and from where will you start investigating the issue? There may be lots of questions buzzing around in your head before starting the troubleshooting process, such as:
It’s crucial to know the ins and outs of the application and environment before jumping on the servers or code. That’s where service maps come in.
Service maps are visual, customizable representations of your architecture showing the connections between and dependencies of applications, databases, hosts, servers, and out-of-process services. They show real-time traffic flow from one component to another and values for latency, requests, and component errors.
One of the primary reasons to map services is to improve the MTTR (Mean Time to Resolution) for major incidents. A service map makes it much easier for a front-line responder to see what components recently (or currently) have incidents associated with them.
We use Datadog Service Map to decompose an application into all its component services and illustrate the observed dependencies between these services in real time. It enables our 24/7 Support Services engineers to identify bottlenecks and understand how data flows through the architecture. It visualizes data that’s already being collected by Datadog Application Performance Monitoring (APM), so setup is automatic. We also use Datadog Incident Management to track incidents, perform troubleshooting, and reduce MTTR. It helps us triage possible issues, do RCA, and ultimately resolve and document the problem.
Tagging is very important in Datadog. We tag incidents with relevant information like severity, whether or not there’s an impact to customers or billing, and what environments have been affected. The “service” tag identifies Datadog’s APM services and connects them to other parts of Datadog, like traces and logs.
The diagram below shows the service map of env:ruby-shop.
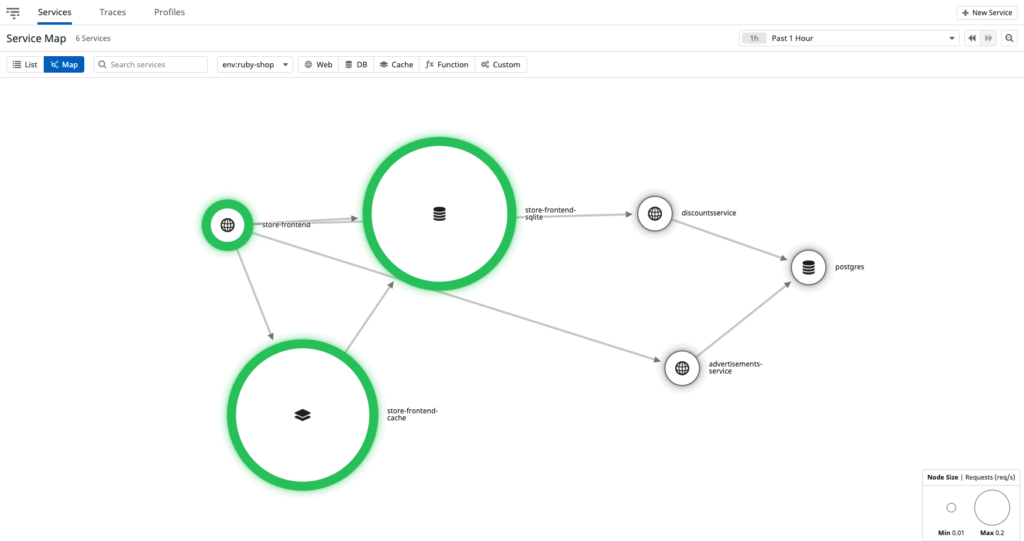
You can drill down to a particular service and navigate to various connected parts. To easily view APM metrics, hover over a service. It will show all the connected resources and components of a service and indicate its flow of traffic.
As shown in the image below, you can navigate to all the related traces, logs, and processes from the service map, helping you find the root cause of the incident.
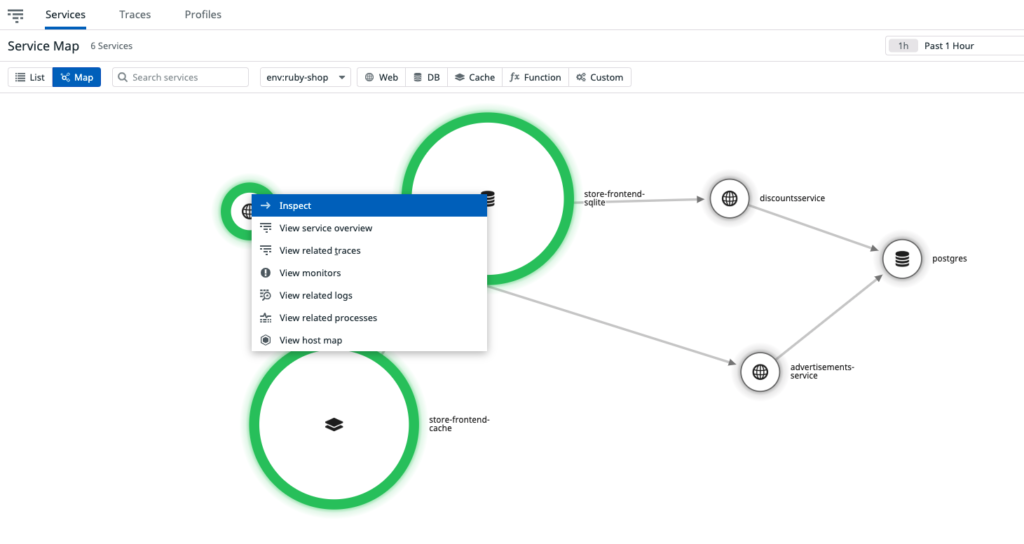
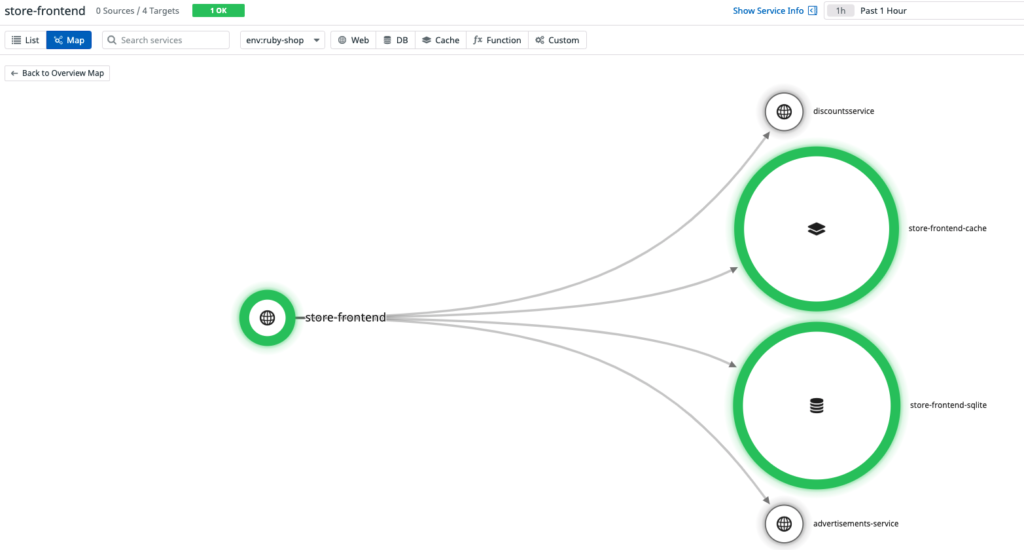
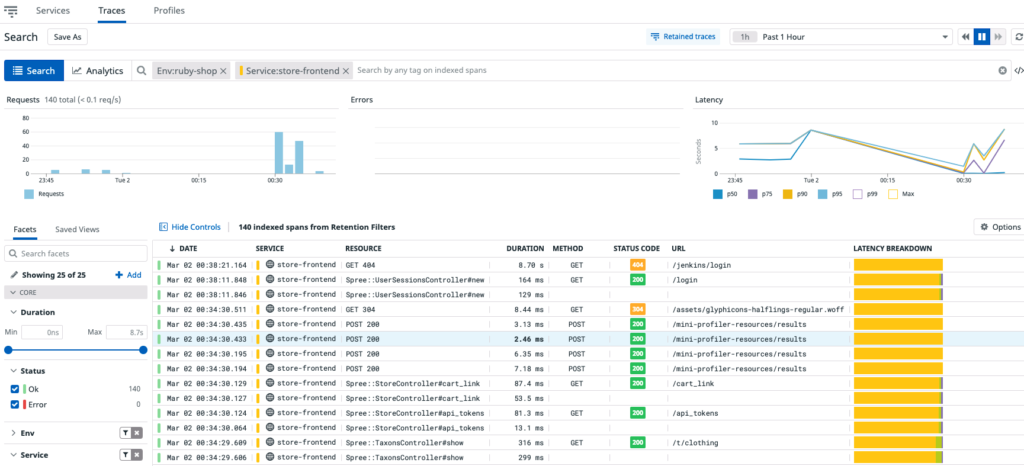
The diagram below shows the related traces from the store-frontend service.
Our 24/7 Support Services engineers accelerate the incident response process for highly complex environments by tapping into the following capabilities of service maps:
Automated discovery and mapping. Service maps automatically discover all the decoupled components of microservices that are used to build applications. There is no need to manually create diagrams and keep editing them whenever something in the architecture is changed.
Visibility. Dynamic visual representation of the entire architecture facilitates evaluation of the underlying impact of infrastructure services.
Improved efficiency and RCA. Service maps are the perfect tool to begin troubleshooting and determine the root cause of the issue.
Discovery of dependencies. There may be many services and external components that depend on the service that is down or having issues. Service maps help discover all the dependent services, indicating the connections and flows between them.
Onboarding. When a new engineer joins the team, service maps accelerate the process of onboarding by providing a clear picture of the project and its dependent services.
To accelerate your incident response process for microservices-based architecture and improve MTTR and RCA, use a service map such as Datadog Service Map. It will enable you to identify bottlenecks and understand how data flows through the architecture. A service map provides a dynamic visual representation of the entire architecture, with automated discovery of dependencies between the decoupled components of an application’s microservices so that you can mitigate costly downtime.
Need help with meeting your AWS infrastructure support SLAs? Would you rather refocus your engineers on innovation instead of providing infrastructure support? The nClouds 24/7 Support Services team is here to help you maximize uptime and business continuity and achieve your AWS infrastructure support SLAs at a competitive rate. Contact us.
Blog Post

Blog Post

Blog Post

Blog Post
